


Topics: Statistics - Graphical Representations of Statistical Data
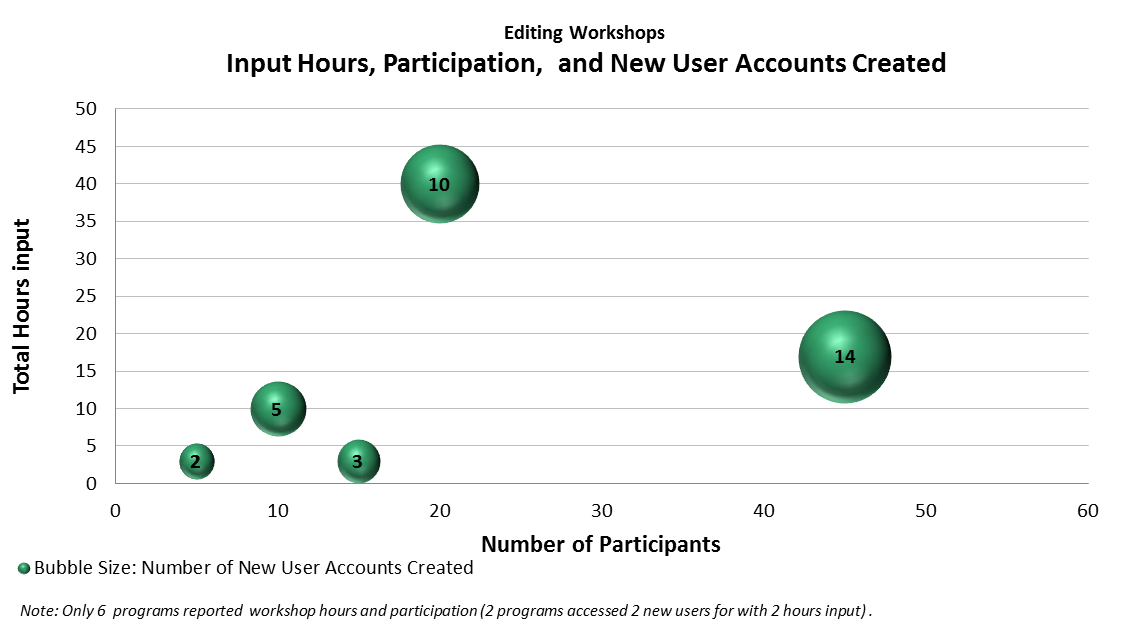
A bubble graph is a graph that shows the relation between three variables.
 Notkesto
Search
Topics: Statistics - Graphical Representations of Statistical Data
A bubble graph is a graph that shows the relation between three variables.